
Identifying a stock that attracts attention because of positive corporate announcements, industry developments, or changing market conditions is only one part of the stock selection process. A favourable development does not necessarily mean that a stock is ready for a trading opportunity.
Before considering a trade, it is important to understand how the stock is behaving in the market.
This is where technical confirmation becomes relevant.
Technical analysis helps traders evaluate price movements, market trends, trading volume, and relative performance. These factors indicate market participation and whether a stock is showing signs of strength, weakness, or uncertainty.
For swing traders in particular, understanding technical confirmation can help distinguish between stocks that are merely attracting attention and those demonstrating constructive price behaviour.
Here, we explore the important elements of technical confirmation and how traders can use them to evaluate stocks more effectively.
1. What Is Technical Confirmation in Stock Trading?
Technical confirmation is the process of analyzing a stock’s price behavior, trading volume, and technical indicators to determine whether market conditions support entering a trade.
It helps traders answer questions such as:
- Is the stock moving in an established trend?
- Is the price showing strength or weakness?
- Is there sufficient market participation behind the price movement?
- Is the stock outperforming or underperforming its benchmark?
- Are there signs of a possible trend continuation or reversal?
A stock may attract attention because of a significant announcement; price action may indicate that the market has already reacted, that buying interest is weak, or that the stock remains in a sideways phase.
Understanding these differences is important before making a trading decision.
2. Understanding Price Trends
Price trend analysis is one of the basic elements of technical analysis.
A stock’s price movement generally falls into three broad categories.
Uptrend
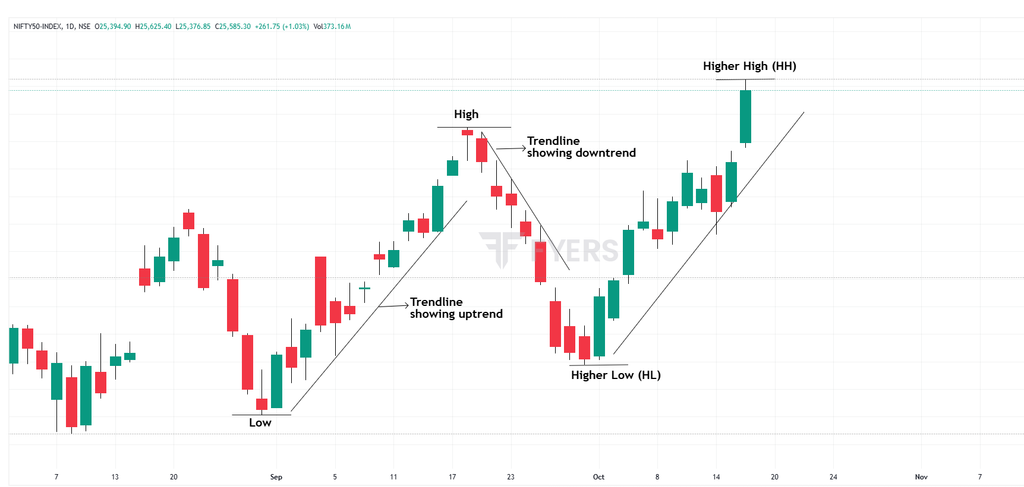
The stock generally forms higher highs and higher lows, indicating that buyers are maintaining control of the price movement.
Downtrend
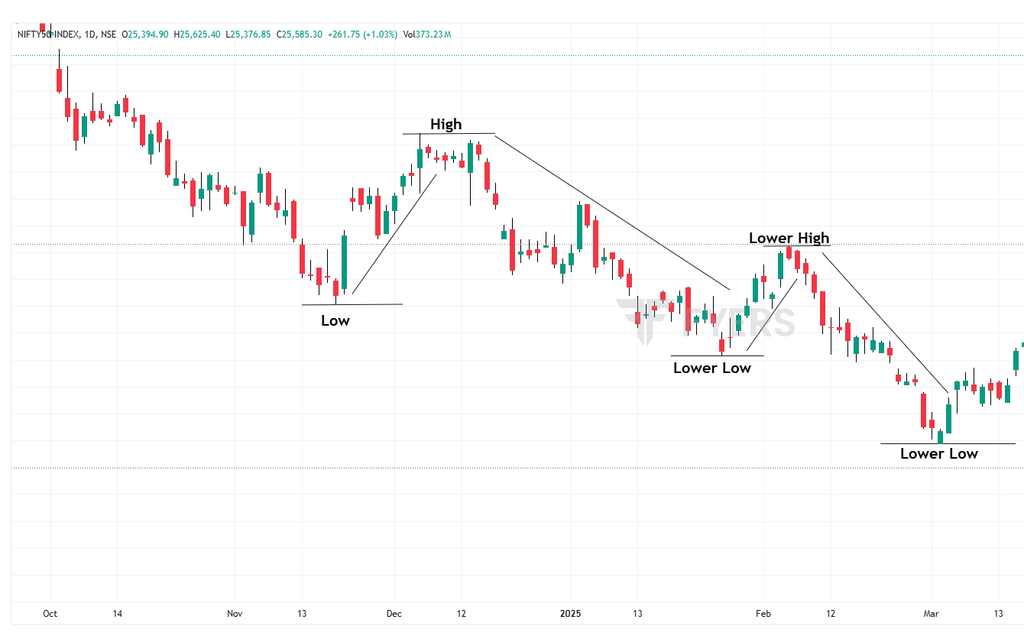
The stock forms lower highs and lower lows, suggesting persistent selling pressure.
Sideways Trend
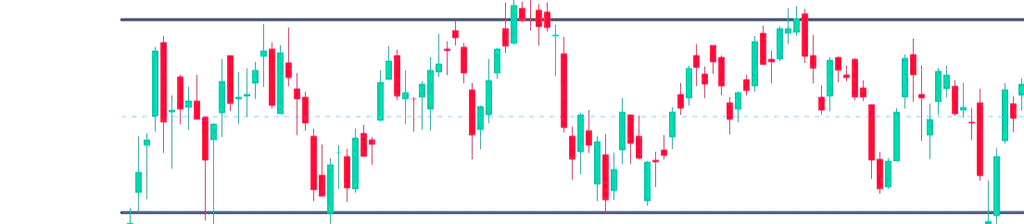
The stock moves within a relatively defined price range without establishing a clear upward or downward direction.
Understanding the prevailing trend helps traders assess the stock’s current behaviour rather than relying entirely on recent price movements.
For example, a stock that rises sharply for two sessions may appear bullish. However, if its broader trend remains downward, the recent increase may represent only a temporary recovery.
3. Using Moving Averages to Understand Stock Trends
Moving averages are widely used technical indicators that help smooth out price fluctuations and identify the general direction of a stock’s trend.
Three commonly followed moving averages are:
| Moving Average | Common application |
| 20-day EMA | Short-term price trend |
| 50-day EMA | Intermediate trend |
| 200-day EMA | Long-term trend |
EMA stands for Exponential Moving Average. It gives greater weight to recent prices.
How traders interpret moving averages
- Price trading above a moving average may indicate relative price strength.
- Price trading below a moving average may indicate weakness.
- Upward-sloping moving averages can suggest a positive trend.
- Downward-sloping moving averages can indicate a weakening trend.
- The relationship between different moving averages can provide additional information about trend direction.
However, moving averages are lagging indicators. They respond to past price movements and should not be treated as standalone buy or sell signals.
4. Relative Strength: Comparing a Stock with the Market
A stock may be rising in price, but that does not necessarily mean it is outperforming the broader market.
This is why relative strength analysis is useful.
Relative strength measures how a stock performs compared with a benchmark index or its sector.
A stock that declines less than its benchmark during a market correction may demonstrate relative resilience.
Why relative strength matters
Relative strength can help traders:
- Identify stocks outperforming the broader market.
- Compare companies within the same sector.
- Identify stocks showing resilience during market weakness.
- Avoid assuming that every rising stock is necessarily strong.
It is important to distinguish relative strength from the Relative Strength Index (RSI).
Relative strength compares performance against another security or benchmark, whereas RSI is a momentum oscillator that measures the speed and magnitude of recent price changes.
Both can provide useful information, but they measure different things.
5. Understanding Volume in Technical Analysis
Price tells traders what happened. Volume provides additional information about the level of market participation behind that movement.
Trading volume represents the number of shares exchanged during a particular period.
Volume analysis can help traders understand whether a price movement is accompanied by increased or reduced participation.
Common volume observations
| Price Movement | Volume Behaviour | Possible Interpretation |
| Price rises | Volume increases | Stronger participation in the upward move |
| Price rises | Volume decreases | Lower participation; further evaluation may be needed |
| Price falls | Volume increases | Increased selling participation |
| Price falls | Volume decreases | Reduced selling participation |
These are general observations, not definitive trading signals.
Why compare volume with its average?
Looking at volume in isolation can be misleading because trading activity varies across stocks and market sessions.
Comparing current volume with its recent average can help traders identify unusual increases or decreases in participation.
For example, a stock moving above an important resistance level with noticeably higher-than-average volume may attract more attention than a similar price movement occurring on unusually low volume.
However, a volume spike can also occur because of block deals, bulk deals, corporate announcements, or other one-time events. The underlying reason must be evaluated before reaching a conclusion.
6. Combining Price, Moving Averages, Relative Strength and Volume
Individual indicators provide only part of the picture.
A more balanced assessment involves observing how different technical factors behave together.
Consider the following illustrative example.
Example: A hypothetical stock under technical evaluation
| Technical Factor | Observation |
| Price Trend | Higher highs and higher lows |
| Moving Averages | Price trading above the 20-day and 50-day EMAs |
| Relative Strength | Outperforming its sector index |
| Volume | Recent upward movement accompanied by increased volume |
Taken together, these observations suggest constructive technical conditions.
However, this does not automatically make the stock suitable for immediate entry.
Traders still need to evaluate important factors such as:
- Nearby resistance levels.
- Potential support zones.
- Overall market conditions.
- Risk-to-reward considerations.
- Volatility and liquidity.
The purpose of combining technical observations is to develop a more complete understanding of a stock rather than depending on a single indicator.
7. Common Mistakes Traders Should Avoid
Technical analysis is useful, but incorrect interpretation can lead to poor trading decisions.
Some common mistakes include:
1. Treating every price increase as a bullish signal
A short-term price increase does not necessarily indicate a sustainable trend.
2. Depending on a single indicator
Moving averages, RSI, or volume should not be interpreted in isolation.
3. Ignoring the broader market trend
A stock may show temporary strength while the overall market remains weak.
4. Chasing sudden price movements
Sharp price increases can attract attention, but entering without evaluating volatility, support, and resistance may increase trading risk.
5. Ignoring liquidity
A stock may display an attractive chart but still have insufficient trading activity for practical trade execution.
6. Confusing technical strength with guaranteed returns
Even stocks showing constructive technical conditions can experience sudden reversals.
8. Technical Confirmation Is Not the Same as a Trading Decision
One important distinction traders should understand is that technical confirmation and trade execution are two different activities.
Technical analysis helps evaluate the stock’s market behaviour.
A trading plan determines how a trader intends to manage the potential opportunity.
Before considering an entry, traders should have clarity about:
- The price level at which they would consider entering.
- The conditions that would invalidate their trading idea.
- The amount of capital they are prepared to risk.
- The appropriate position size.
- The potential reward relative to the risk involved.
A technically strong stock may still offer an unfavourable risk-to-reward opportunity at its current market price.
Therefore, technical observations should support a disciplined decision-making process rather than encourage impulsive entries.
9. Importance of Technical Confirmation
Technical confirmation is an important part of evaluating stocks for trading.
Price trends help traders understand market direction. Moving averages provide a broader view of trend behaviour. Relative strength helps identify outperforming stocks, while volume offers insights into market participation.
When these elements are considered together, traders can develop a more informed understanding of a stock’s technical condition.
However, no indicator or combination of indicators can eliminate market uncertainty.
The objective is not to predict every price movement but to evaluate available information, recognise potential opportunities and approach trading decisions with appropriate risk management.
Successful trading is not simply about finding stocks that are moving. It is about understanding why they are moving, evaluating the quality of that movement and managing the associated risk.
StocksNStats focuses on market information, independent research, and educational resources to help traders develop a more structured approach to understanding the markets.